Pune Real Estate Market H1 2025: Price Trends, Top Micro-Markets & Outlook
Pune home sales held steady in H1 2025 while prices rose 6% and unsold stock grew 14%. Wakad led West Pune with 18% price growth; Baner and Hinjewadi rose about 7%.
Overview
The first half of 2025 showed a Pune real estate market that was steady rather than booming. Sales held almost flat, prices kept rising, and unsold stock grew. That mix matters for buyers: it means more choice and room to negotiate in some projects, even as average prices move up.
The figures below come from published research: Knight Frank India's India Real Estate: Residential and Office Market H1 2025 report and Maharashtra IGR registration data.
Key Highlights: H1 2025
| Measure (Pune, Jan–Jun 2025) | Figure | Change vs H1 2024 |
|---|---|---|
| New home sales | 24,329 units | down 1% |
| New launches | 26,559 units | down 5% |
| Weighted average price | ₹4,868 per sq ft | up 6% |
| Unsold inventory | 48,646 units | up 14% |
| Property registrations (IGR) | 1,16,043 | up 16% |
Source: Knight Frank India, H1 2025; registrations from Maharashtra IGR as reported in July 2025. Registrations count every deal, including resale, so they are not the same as new-home sales.
A few points stand out:
- Prices rose for the seventh half-year in a row, by 6% on average across the city.
- Unsold stock grew faster than sales. Knight Frank puts it at about 3.7 quarters of sales, so buyers have choice in many micro-markets.
- Larger tickets are a bigger share of the market. Homes above ₹1 crore made up 25% of sales, up from 20% a year earlier.
- West Pune leads. Aundh, Baner, Wakad, Hinjewadi, Bavdhan and Pashan together accounted for 43% of launches and 40% of sales.
Micro-Market Breakdown
Knight Frank's locality data shows how differently West Pune's markets moved over the 12 months to June 2025:
| Locality | Price change, 12 months | Price change, 6 months |
|---|---|---|
| Wakad | up 18% | up 15% |
| Baner | up 7% | up 4% |
| Hinjewadi | up 7% | up 3% |
| Aundh | up 2% | up 1% |
Baner
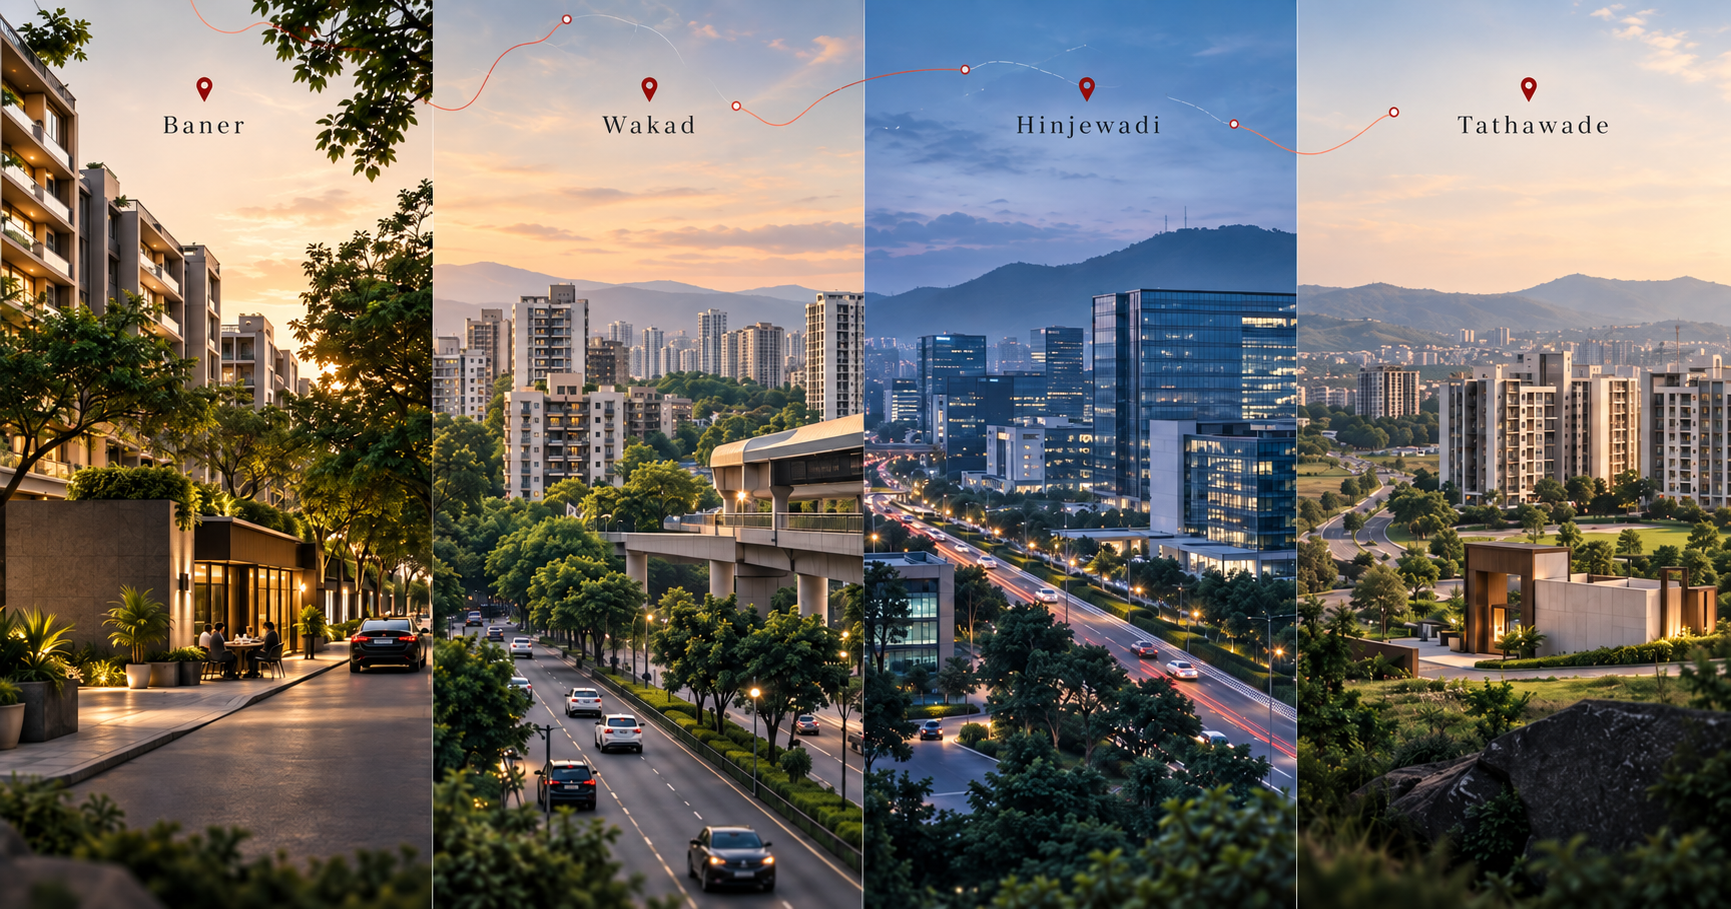
Baner remained one of Pune's premium addresses, with prices up about 7% over the year. Browse current projects in Baner, including the larger homes on Pan Card Club Road.
Wakad
Wakad was the standout in Knight Frank's data, with prices up about 18% over 12 months. Compare projects in Wakad, and note that many projects marketed as "Downtown Wakad" are in Tathawade.
Hinjewadi
Prices near the IT parks rose about 7%. Buyers here should weigh workplace proximity against the area's ongoing road and civic-infrastructure work. See flats near Hinjewadi Phase 1.
Pimpri-Chinchwad
PCMC continues to offer value compared with West Pune's premium pockets, with larger developer-backed projects such as Mahindra Citadel. Check the Pimpri-Chinchwad page for current projects and published prices.
How to Read These Numbers
Headline figures for the Pune real estate market come from different sources, and they measure different things. Mixing them up is the most common reason buyers draw the wrong conclusion.
- Sales and launches in Knight Frank's report count new homes sold and launched by developers in that half-year. They leave out resale homes.
- Registrations from IGR count every property deed registered, including resale flats, plots and commercial units. A rise in registrations does not mean developers sold more new homes.
- The weighted average price is a city-wide figure across all the projects tracked. It is useful for spotting the overall trend, but it is far below what you will pay in Baner or Wakad, because it includes lower-priced suburbs.
- Locality price changes show the direction of a micro-market. They are not a quote for any single project, where the developer, tower, floor and timing all affect the price.
The practical takeaway: use the market data to decide where to look and how much room you have to negotiate, then judge each project on its own cost sheet, approvals and delivery record.
What Should Buyers Do?
Rising average prices alongside growing unsold inventory send a mixed signal, which is why project-level comparison matters more than city averages:
- Compare complete cost sheets, not just the price per sq ft. Stamp duty, registration and GST add significantly to the agreement value.
- Use the inventory to your advantage. Where several projects compete in the same micro-market, ask about payment plans and what is included in the price.
- Verify before you book. Check every project on the official MahaRERA portal: registration, promoter, completion date and quarterly updates.
The Pune real estate market rewards buyers who compare carefully. For a side-by-side view of West Pune's main locations, read our Baner vs Wakad vs Hinjewadi vs Tathawade guide.
Want a personalised analysis for your budget and location? Book a free advisory call with the PROPHUNT team.
Frequently asked questions
How much did Pune property prices rise in H1 2025?
Knight Frank India reported a weighted average price of about ₹4,868 per sq ft for Pune in H1 2025, up 6% year on year. Locality-level growth varied, from about 2% in Aundh to about 18% in Wakad.
Did Pune home sales grow in H1 2025?
Not really. Knight Frank recorded 24,329 new home sales in Pune in H1 2025, down 1% from H1 2024, while unsold inventory rose 14%. Property registrations, which include resale, rose 16% to 1,16,043 according to Maharashtra IGR data.